October 22, 2018 - Institutional Positions & Supply and Demand for the Majors, Gold and Oil!
- White Oak University
- Oct 23, 2018
- 2 min read
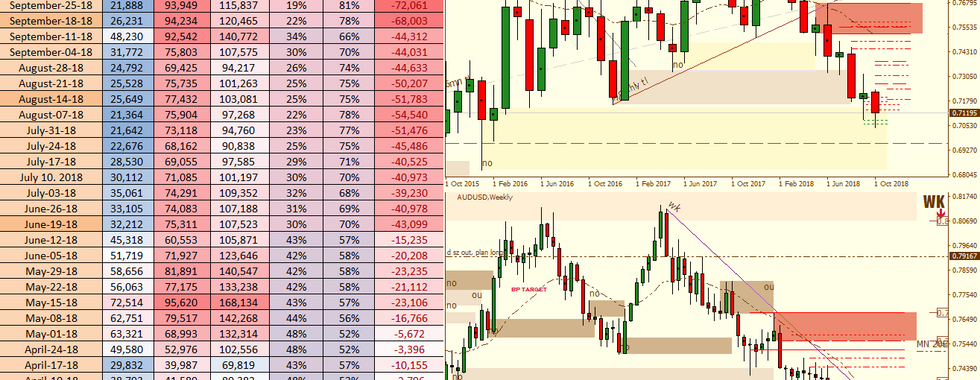
The positions below represent the institutional positions held as of October 16, 2018!

The data this week is providing a lot of insight for us but more importantly I think is what we can see on the charts. For instance, the #eurusd hitting weekly demand just as the #gbpusd is and the #nzdusd as well and on the flip side we have the #usdcad, #usdchf and #usdjpy reacting from weekly supply. When you take a look at #gold you can see that it has broken from its range and pushed upwards which is exactly what we have been expecting these last few weeks. All this signs are all pointing in the same direction. We see some hedging and preparation beginning to form for a reversal in price but it is still a bit early to know for sure.
This week we also saw #oil hitting the weekly supply zone we've been watching for some time now and what did we see take place here? SELLING! This is what we have expected and to see it play out so perfectly is pure magic! It will take some time, if this is what is to be expected, to see the institutions reduced their long positions and slowly start to build a larger short presence. As this plays out, it will give enough time for the #usdcad to do its thing and build momentum to shift price higher. This is working and playing out so perfectly. I am watching both charts to see how aligned they are with each other and it’s impressive to see just how connected they are to one another. #Oil has produced an institutional short signal and I will update the portfolio for members this week.
Hang on to your seats ladies and gents as things will start to heat up a bit these next few weeks. Many opportunities to get involved in the markets are coming. I have been receiving messages from members sharing their trades with me that were based on the analysis from this report and I want to congratulate them on their success. Keep up the great work everyone!
Magic Trader!


Comentarios